Friday, June 27, 2014

The Neutral Model of evolution and recent African origins


by

The Recent African Origins (RAO) theory is on tenuous ground. It relies deeply on the Standard Neutral Model of evolution (SNM), but every assumption behind SNM and, therefore, RAO has been openly questioned in the evolutionary literature. If real-world populations violate the central assumptions of SNM, the conclusions of studies that assume SNM are not the final word on the subject. The real situation is much more complicated than the simplifying assumptions allow, and several of these assumptions are either biased in favour of the conclusion or are contrary to the data: crossing over is not random, population structure exists at all scales, and population admixture and gene conversion overly complicate the models. The presence of natural selection among human mitochondria removes the ‘neutral’ part of SNM as far as RAO’s ‘Mitochondrial Eve’ is concerned. Finally, RAO and SNM are based on the belief that evolution can occur, but that it cannot affect the things that control the speed of evolution. There is no room for differences in mutation rates among populations caused by environmental stress, nutrition, demographics or mutations in the DNA copying, proofreading or correcting mechanisms. The most popular evolutionary model of recent human evolution is unsatisfactory, but the biblical model for human genetic history is still in its infancy. Outlined are several lines of thought that may be productive to creationist research.

‘The challenge of genetic studies of human history is to use the small amount of genetic differentiation among populations to infer the history of human migrations’ (Rosenberg et al. 20021).
Human mtDNA Migrations
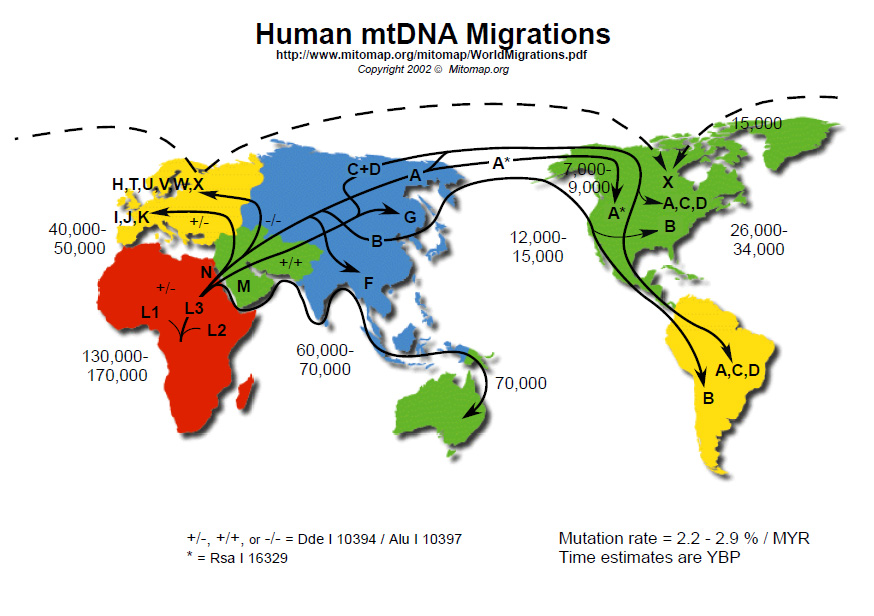
Figure 1. This map shows the Recent African Origins concept in detail. According to RAO theory, modern humans originated in Africa, diversified there, and then one lineage (with several major clades) migrated away to populate the rest of the world. This is very similar to the biblical concept, only with a different starting point (Middle East) and a different time frame. (From MITOMAP: A Human Mitochondrial Genome Database, , 2008).
This quote illustrates an important point. Modern geneticists are struggling to understand human genetic history. In the end, they are forced to make certain inferences based on limited data and a suite of simplifying assumptions. The purpose of this article is to look at the underpinnings of the Recent African Origins (RAO) model of human evolution, first popularized by claims of the discovery of ‘Mitochondrial Eve’ in Africa.2 Each of the fundamental assumptions behind the theory has been openly questioned in the evolutionary literature. If any one of the assumptions behind RAO falls, the entire theory may be made moot. By listing the assumptions and then systematically showing how each one is impractical, impossible, contradictory or biased in favour of evolutionary theory, I hope to bring RAO down a few notches.
The term ‘recent’ is used by RAO supporters in a deep-time sense and is not meant, by them, to be taken as support of a young Earth. According to RAO, humans evolved in Africa, existed as a small population for some hundreds of thousands of years, and then rapidly expanded into the rest of the world about 200,000 years ago. As an explanatory tool, it stands in direct opposition to the biblical model, where the most important genetic signals should be the Creation (which limits overall human diversity), the Flood (a bottleneck event), and the Tower of Babel event (which led to significant population subdivision and a world-wide migration). The last two are expected to yield similar results to the hypothetical RAO model, but with a different timescale.
I will caution the reader at this point. This article might seem to overthrow all arguments based on neutral evolution or bottleneck theories (both terms will be defined below). Creationists sometimes use those theories to their advantage, and it is not my intent to completely discount them. In fact, RAO uses much of the same mathematics many creationists would like to apply to the biblical model. My intent is to take a more ‘surgical’ approach, cutting out the ‘cancer’ of bad science, while leaving untouched any science that may yet be valid and useful. And in arguing against RAO, I am actually arguing for a more recent origin of humanity, though this is not my focus here and will not come through strongly in this article.
The goal of this paper is to highlight the places where they make unrealistic assumptions in their favour, and, by pointing out how unrealistic these assumptions are, I hope to dispel some of the RAO [Recent African Origins] mythology.
RAO makes a number of approximations, as do all theories by necessity. For this reason, almost any theory can be attacked for being ‘unrealistic’. The goal of this paper is to highlight the places where they make unrealistic assumptions in their favour, and, by pointing out how unrealistic these assumptions are, I hope to dispel some of the RAO mythology.
RAO does not support large-scale, deep-time evolution. There is nothing evolutionary about humans moving out of, or into, Africa at any time. Rather, the importance of the theory lies in the issue of dating and rooting the human genealogical tree. The following quote from the seminal RAO paper is going to be the focus of everything that follows: ‘We infer … that Africa is a likely source of the human mitochondrial gene pool. This inference comes from the observation that one of the two primary branches leads exclusively to African mtDNAs …, while the second primary branch also leads to African mtDNAs.’2 If we can dissect this, we will be far along the road to a better theory of human genetic history (figure 1).

The Standard Neutral Model of evolution

RAO is based on the Standard Neutral Model of evolution (SNM), itself being based on a long line of theoretical arguments, starting with J.B.S. Haldane’s writings in the 1950s. It is important to understand the development of this theory if we are to understand RAO.
Haldane (1957)3 was the first to discuss the concept known as the ‘cost of substitution’. According to Haldane, natural populations should not be able handle the number of deaths required by natural selection to drive positive evolution. Put simply, higher vertebrates do not have a high enough reproductive rate to support rapid rates of beneficial evolution. It takes too many deaths (the ‘cost’) to select for new mutations. Many creationists argue ‘Haldane’s Dilemma’ has not been sufficiently answered to date.4

The tree that started it all. Cann et al.2 based their ‘Out of Africa’
conclusion on the fact that the first major branch in their tree leads to all African
sequences on one side and mixed African/world sequences on the other. This
conclusion is based on a suite of assumptions that are discussed at length in
the text.
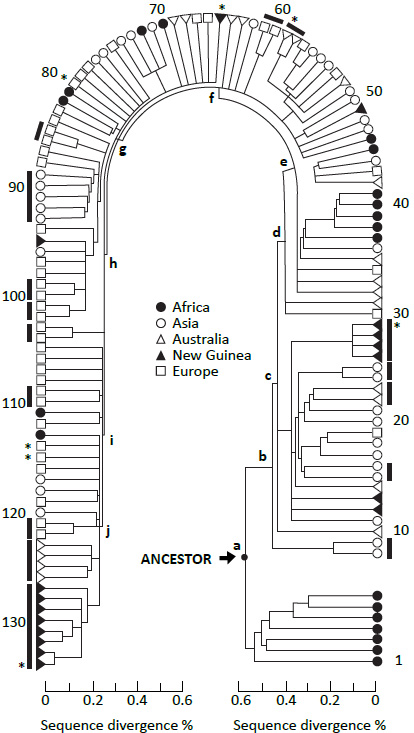
Figure 2. The tree that started it all. Cann et al.2 based their ‘Out of Africa’ conclusion on the fact that the first major branch in their tree leads to all African sequences on one side and mixed African/world sequences on the other. This conclusion is based on a suite of assumptions that are discussed at length in the text. (From figure 3 of Cann et al.2).
Motoo Kimura took Haldane’s argument one step further by applying it to measured genetic differences between mammals. Following Haldane, he reasoned that if the genetic differences between two species were all due to positive selection, and if they evolved within the standard evolutionary timescale, then mammals would have needed an astronomically high reproductive rate to give natural selection enough fodder to drive evolutionary changes. For example, humans and chimpanzees have millions of genetic differences, but 3 million years would give us only about 100,000 human generations in which to fix these millions of differences. According to evolutionary calculations, natural selection would have had to remove many times more people than could possibly have been born during this time in order fix this many differences. To solve the dilemma, Kimura reasoned the majority of new mutations must be ‘neutral’ (this is the origin of the belief that most of the genome is composed of ‘junk DNA’, a term discussed elsewhere in this journal5). The rate of neutral evolution could be much faster than positive evolution, and would be limited only by the rate of DNA copying errors. Since natural selection will not act on neutral traits, which do not affect survival or reproduction, neutral evolution can proceed through random drift without any inherent cost of selection. Kimura saw Haldane’s Dilemma as a serious problem and listed it as his main reason for proposing the Neutral Theory of evolution.6 Haldane was right, Kimura asserted, but the preponderance of biological change must be neutral.
The Neutral Model has been expanded by many authors to become what we will call the Standard Neural Model (SNM). SNM was developed to cover complex historical patterns such as bottleneck events. It is the fundamental underpinning of RAO.
The following is a list of assumptions critical to the RAO model. Note how SNM is intrinsic to RAO theory (figure 2):
Constant population size. Although the Neutral Model is unaffected by population size, SNM was developed partly to model changes in population size (specifically one cycle of population bottleneck). RAO assumes a single human population with a single expansion event and no subsequent sub-population bottlenecks or other demographic differences.
Random mating (no population substructure, geographic or otherwise). Again, Neutral Theory is not contingent upon random mating, but RAO is. Population substructure prior to or after the Out of Africa Event might hide the true picture of human demographic history.
Neutral polymorphisms. There can be no selection acting on the alleles under question. RAO is based on the assumption that the entire mitochondrial genome is essentially neutral, or at least that negative mutations are efficiently eliminated. For detailed critique of this, see Sanford.7
An infinite-sites model of mutation. There cannot be multiple mutations at identical sites in different lineages and back mutations are not allowed. In some sense, this is a reasonable approximation, given the large size of the genome and the small number of generations involved (in the Creation model) or with the low rate of mutation (in evolutionary models). The approximation also simplifies the theoretical understanding and calculations. However, if this approximation turns out to be incorrect, RAO becomes harder to understand and the calculations behind it become less tenable.
Constant mutation/substitution rate among all subpopulations (the ‘molecular clock’). To illustrate how critical this is, I will quote Cann et al.:2 ‘A time scale can be affixed to the tree … by assuming that mtDNA sequence divergence accumulates at a constant rate’.

Simplified mtDNA tree from <www.mitomap.org>. This diagram shows the relationship among
the major mitochondrial lineages. Because it is not presented in a traditional tree format, it is easy to see
how difficult it is to determine where the ancestral sequence should be placed. Carter placed the root not
in Africa, but at the ’R’located close to the centre of the tree.
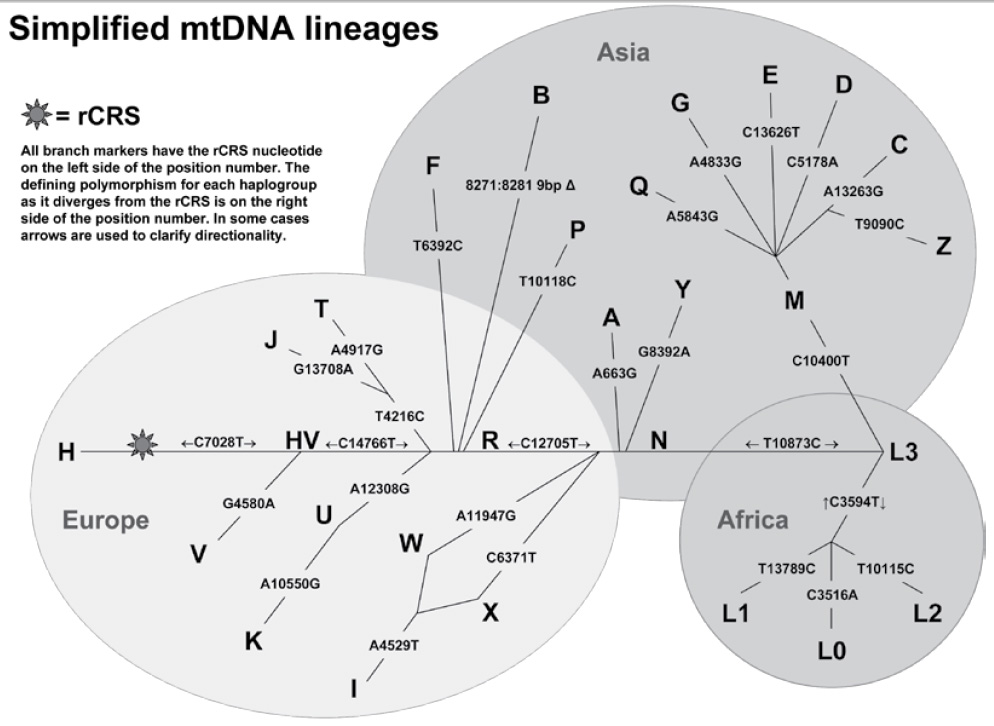
Figure 3. Simplified mtDNA tree from . This diagram shows the relationship among the major mitochondrial lineages. Because it is not presented in a traditional tree format, it is easy to see how difficult it is to determine where the ancestral sequence should be placed. Carter39 placed the root not in Africa, but at the ’R’located close to the centre of the tree. (From MITOMAP: A Human Mitochondrial Genome Database, , 2008).
Constant effective generation time among all subpopulations (typically assumed to be 20 years for humans, although values between 20 and 30 have been used by various authors).
A human-chimp common ancestor some 3–6 million years ago. This is not an assumption of SNM, but is needed for calibrating the SNM bottleneck event. Essentially, by counting the number of differences between chimp and human mitochondria, and by then dividing this number by 3 to 6 million, one can get an estimate of the number of mutations that supposedly accumulate in the populations per year.

Tajima’s D statistic

Tajima’s D statistic8 is used to test SNM along a given stretch of DNA. It is basically a summary of the allele frequency spectrum. D values not significantly different from zero indicate the population meets all the criteria for SNM. Positive and negative values are due to an overabundance or dearth in the expected number of rare polymorphisms, respectively. Significant positive or negative values of D may indicate the presence of natural selection or historic changes in population size or multi-population introgression. This is an important metric for both SNM and RAO theory.
Historic changes in population size are expected to influence Tajima’s D statistic in that population growth should lead to excess low-frequency polymorphisms (negative D-values). This occurs because new mutations are carried along with the expansion and do not exit the population as easily through random drift. Alternatively, population bottlenecks should lead to a deficiency in low-frequency polymorphisms (positive D-values) because most low frequency alleles are eliminated through random selection.

Linkage disequilibrium

SNM needs to be put in the context of sexual reproduction. During gamete production, crossing over occurs between chromosome copies. This mixing causes randomization of the alleles (variations) along a stretch of DNA. However, because there are only one or two crossing over events per chromosome arm per generation, not all alleles are randomized each generation. And, the closer two alleles are, the less likely they are to be separated. Alleles in close proximity are said to be ‘linked’. This is also true of alleles separated by regions of infrequent crossing over. Geneticists use the term ‘linkage disequilibrium’ (LD) to describe the unequal association of certain alleles with certain other alleles. A set of alleles inherited together are referred to as a ‘haplotype’.
Population growth not only leads to negative D values (excess low frequency alleles), it also leads to less LD because crossing over randomizes more and more alleles each generation. Alternatively, population bottlenecks should lead to higher LD because during a bottleneck event a small number of people pass their large linkage blocks on to the entire population. It takes time for the haplotypes to be scrambled.

Expectations of SNM

The population parameters used in SNM calculations must be estimated, and this is no easy task. For humans, the mutation rate is based on current levels of genetic diversity, the assumption that the vast majority of that genetic diversity is neutral, and an assumed chimp-human ancestor 3–6 Ma. In other words, the calculation assumes large-scale evolution (i.e. macroevolution) is true. The effective population size (Ne) is also estimated from observed levels of diversity. But Ne is also dependent upon the generation time and the time to a common ancestor, two parameters about which little is known.9 Given an equal number of males and females and random mating, the ratio of hypothetical Ne for the autosomes, X chromosome, non-recombining portion of the Y chromosome (NRY), and mtDNA is 4:3:1:1, respectively. The reduced Ne is expected to produce more rapid differentiation among populations for the haploid loci than for the others.10 This is one reason why RAO was initially based on mitochondrial sequences.
The bottleneck event associated with the Flood would have created a strong signal that should still be evident today. Any model of human history that does not take this into account will come to incorrect conclusions if the Flood story is accurate.
Since the calculation of the time to a most recent common ancestor (TMRCA) is directly proportional to Ne, TMRCAs for the autosomes and the X chromosome are expected to be 4 and 3 times greater, respectively, than for the two haploid loci.10 But this ignores the possibility that there was only one male lineage (Noah’s Y chromosome) and only three female lineages (the mitochondrial chromosomes of Noah’s three daughters-in-law) in the founding human population. The bottleneck event associated with the Flood would have created a strong signal that should still be evident today. Any model of human history that does not take this into account will come to incorrect conclusions if the Flood story is accurate.
SNM assumes that differences in LD among populations are due to differences in demographic history.11,12 This assumption depends, of course, on a constant rate of recombination, mutation and gene conversion in all subpopulations and a lack of ancient population structure (all of which affect LD). However, all it takes is one change in a DNA repair enzyme, one change in a gene that affects the rate of recombination, or one change in a gene that affects the process of gene conversion in one of the populations and the SNM results will diverge from reality. Thus, SNM assumes populations do not diverge in respect to certain genetic traits but are free to diverge in respect to others. This is perhaps the most critical point to understand.
According to SNM, low frequency alleles should be generally younger. As new alleles appear in the population, most of them will be lost through random drift. In fact, a new allele has a 1/Ne chance of eventually becoming fixed. In large stable populations, nearly all low frequency alleles are expected to be young. Younger alleles are also generally associated with longer haplotypes than high frequency alleles13 since it takes time to break down linkage blocks and shuffle new alleles in relation to older ones. Recombination is assumed to be neutral and random and to occur at a higher rate than mutation.10
By definition, the more linkage blocks a population has, the greater its expected ability to maintain polymorphism (linkage increases the variance of the numbers of polymorphic sites14). Higher levels of Ne also allow a population to maintain polymorphism (and a higher numbers of linkage blocks). The conclusion that African populations have maintained a larger long-term effective population size than non-African populations14 is based on the levels of polymorphism found in the populations, under the assumptions of SNM. But are the assumptions valid?

Violations of SNM

Violations of every assumption behind SNM have been detected and published in the evolutionary literature. Real-world populations do not conform to the constraints of SNM. Therefore, we must be careful when reading the conclusions of the many studies that have been based on this evolutionary theory.
Therefore, violations of SNM [Standard Neutral Model] should be expected to occur frequently. One may rightly question the utility of a model that cannot be fit to real-world data.
SNM is a necessary simplification that allows for the study of a highly complex system. However, violations of SNM are expected at all levels: population structure, subpopulation bottlenecks, small-scale variations in recombination rates and multi-population admixture all increase estimates of LD9 and interfere with SNM calculations. Also, haplotype patterns can be disrupted by recurrent mutation, gene conversion, genome assembly errors and errors in genotyping.12 When deviations from the SNM occur (e.g. the conclusions of the majority of studies performed on the European population), the meaning of the estimated population parameters is unclear.14 In the real world, it is understood that generations overlap, that Ne fluctuates over time, that gene flow between populations changes over time and that population structure occurs within populations worldwide. Therefore, violations of SNM should be expected to occur frequently. One may rightly question the utility of a model that cannot be fit to real-world data.

Ne

One needs a good estimate of Ne in order to perform most SNM calculations, but Ne estimates are affected by several parameters, the effects of which must often be discounted in order for the model to run. Calculations of long-term Ne are disproportionately affected by low values (population contractions):10 therefore, the reported values should tend to be underestimates. Generation time also heavily influences Ne . In general, greater generation times are expected to result in proportionally lower Ne (and visa versa). Most LD studies assume generation times are equal among populations, something that cannot be historically proven. Cultural as well as genetic differences may lead to differences in generation times. Also, estimates of generation time from modern genealogical data are greater than the 20-year generation time commonly assumed in these studies (for example, 10 generations in my family tree = 300 years, or 30 years/generation). And, according to the biblical data, there should not be a constant generation time, because generation time decreased significantly immediately after the Flood.
Higher levels of Ne are expected to result in less genetic drift, slowing the divergence of populations. Human Ne has often been estimated to be about 10,000 people. Interestingly, due to their calculated inbreeding coefficient, Reich et al.11 estimated a historic human Ne of ‘50 individuals for 20 generations; 1,000 individuals for 400 generations; or any other combination with the same ratio.’ I would like to point out that 5 individuals for 2 generations fits their ratio and corresponds roughly with with biblical expectations. Is this evidence of the Flood (six people for one generation), or are these calculations so entrenched in evolutionary theory that they are not useful? Frisse et al.14 found disagreement between estimates of Ne for non-African populations based on LD and polymorphism data. This is another example of real population data in conflict with SNM assumptions. Which Ne should one use?
For unexplained reasons, the estimate of a historic human Ne of 10,000 individuals is much less than Ne estimates for the great apes.10 There is a huge amount of diversity among living chimpanzees:15 perhaps as much as three to four times as much diversity as within the entire human population.16 Does this evidence support evolution under an SNM scenario, or is the diversity not so much evidence of ancient Ne as much as it is evidence of a chimpanzee genome in rapid decline?
The calculation of Ne assumes deep time. In the biblical model, calculations of Ne are not done for there is no assumption of long ages. Rather, we say that there was a population bottleneck some 4,500 years ago (the Flood) where the world population was reduced to 3 founding couples (Noah’s sons and daughters-in-law).

Non-random crossing over events

Because we do not know much about the mechanism controlling crossing over events, nor the frequency in which they occur, it is often assumed that crossing over is more or less random. This allows for easier calculations of LD. However, the phenomenon is not entirely random. Recombination ‘hot spots’ have been known for years. It is believed that there is extensive fine-scale variation of recombination frequency within the human genome, and models that incorporate recombination hot spots are often better than ones that assume random recombination.17 We need to get a better understanding of recombination in order to better understand human genetic history. There is much room for improvement and much hope for the biblical model of human origins in this subject. The very presence of long, unmixed linkage blocks suggests a young genome, but we need more data.

Population structure

Random mating, or lack of population structure (specifically for sub-Saharan African population prior to the Out of Africa dispersion), is another key assumption behind the SNM. The effective rate of recombination is expected to be reduced in structured populations because haplotypes constrained within the various subpopulations will not have a chance to recombine as often as they would under panmixia.18 Importantly, failure to recognize population structure can lead to false positives when testing for constant Ne.1 When discussing the possibility of population structure in the presumed ancestral African population, Garrigan and Hammer10 worried that ancestral population structure could have had the effect of increasing ancestral Ne, thus throwing off their calculations. Behar et al.19 claimed that the early evolutionary history of man in Africa involved small and isolated tribes existing independently for thousands of years. This is a critical issue, for small and isolated populations experience inbreeding, rapid drift and the rapid accumulation of new mutations. The situation violates the fundamental assumptions behind the SNM while providing potentially excellent material to support the biblical model: for if several of the sub-Saharan African populations existed in such a condition after the Flood, this might go a long way in explaining why there is more genetic diversity among people of African descent.
The random mating model ignores reality, for population structure is a fact of human existence.20 Individuals have a tendency to choose mates from the same social groups21 and subpopulations in close proximity may be completely isolated from one another. In a study by Bulayeva et al.,22 they showed through genealogical analysis that in a certain village of 2,700 people in Daghestan, only 10 marriages had been consummated by the villagers with outside people over nine generations! And most of these marriages were with neighbouring villages. Bamshad et al.23 showed that the Hindu caste system has preserved a significant event in history—a huge invasion of India from the northwest. Men and women from upper castes are genetically more similar to Eastern Europeans, while those from lower castes are more similar to SE Asians. The religious system among a significant proportion of the Indian population has prevented free mixing for thousands of years! All this says that a realistic model of human demographic history would be overly complex,18 especially if it uses the wrong model of human history. A highly complex model may not be needed however (e.g. Liu et al. 200624), but there are always dangers involved in oversimplification.

Population admixture

Not only is the assumption of no population structure invalid (both world-wide and within subpopulations), but the situation is made more complicated by the mixing of once-separated populations. When previously separated populations come back together, heterozygosity increases. The mixing of haplotypes that arose separately causes an increase of calculated LD, even at unlinked sites.14 Admixture causes substantial variation in genetic ancestry among individuals in a population.1 Interestingly, the block characteristics of a mixed population should be most similar to the populations with the lowest LD.25 In other words, mixing can mask significant amounts of LD. For example, the fascinating admixture of African Bantu females and Jewish males (the ancestors of the Lemba tribes in SE Africa) has created a population with an unusually large number of long linkage blocks (long-distance LD).26

Gene conversion

While LD is known to decrease due to the effects of crossing over, another, less well-known process called ‘gene conversion’ may be at work as well. Essentially, gene conversion is a process by which a section of DNA can copy itself onto a highly similar section of DNA in close proximity. It has been studied extensively in yeast but relatively little is known about the process in mammals.9,14,24 It is expected that gene conversion acts over short distances, breaking down LD between closely-linked markers where crossing over is less likely.9,14 If gene conversion is allowed in a model, calculations of Ne based on the crossing over parameter get much smaller.14 Even though little is known about gene conversion, one recent study concluded that models using crossing over plus gene conversion fit the data better than models with crossing over alone.18 However, the possibility of recurrent mutations complicates this picture by theoretically inflating the apparent level of recombination and biasing gene conversion rates upwards.14 Furthermore, high levels of recurrent mutation can make the phylogenetic signal completely invisible.27
Due to gene conversion, the term ‘NRY’ (the non-recombining portion of the human Y chromosome) is technically a misnomer, for extensive gene conversion (a form of recombination) has been detected in the male-specific regions of the Y chromosome.28,29 It is expected that high levels of gene conversion will slow divergence rates because they systematically eliminate mutational events.

Equivalent mutation rates and active selection

One of the central assumptions behind SNM is that equivalent genetic sequences in diverse populations evolve in a clock-like manner. This can only happen if selection is not acting upon the genetic sequences under question and if mutation rates are equal among all populations. However, there is evidence that a molecular clock is not operating within related clades of African mitochondrial haplogroup L2. Two of the four clades studied by Torroni et al.30 were ‘disproportionately derived’ and they concluded that their results were ‘not consistent with a simple model of neutral evolution with a uniform molecular clock.’ Howell et al.31 indicated that there may be clock violations for all African L mitochondrial haplogroups and that there were differences in clock rates between coding and control regions. Friedlaender et al.32 went so far as to say that the variable mutation rates among mtDNA clades bring the utility of coalescent statistics and associated age estimates into question.
These are key findings, for the deep-rooting branches of the sub-Saharan lineages are foundational to RAO theory. If no molecular clock is operating among them, there is no way to time the African diaspora. And the only basis for claiming these lineages are ancestral is that they are more divergent from the rest of the world population … but how they became so divergent would then be an open question.
Other studies have concluded that deviations from SNM in Europe and Asia may be due to natural selection. Also, natural selection may not be equal among all clades, especially since clades are not distributed equally across all environmental regions.33,34
Cultural factors may also mimic selection. Genghis Khan is ancestor to a surprising number of people in Central and Eastern Asia and is ancestor to perhaps 0.5% (1 out of 200!) of the world’s population.35 If we did not know about the existence of Genghis Khan from historical sources, how would this missing information affect our conclusions about the distribution of Asian Y chromosomes? And if non-random events like this can have such a profound effect on genetic diversity patterns, how could we trust molecular ‘clocks’ that depend so heavily on random mutation and random mating?

Conclusions

If the African sequences are not evolving in a clock-like manner, the Recent African Origins theory must be seriously reworked.
The studies referenced in this paper highlight the tenuous nature of the Recent African Origins theory. RAO relies deeply on the Standard Neutral Model of evolution, but every assumption behind SNM and, therefore, RAO has been openly questioned in the evolutionary literature. If the African sequences are not evolving in a clock-like manner, the Recent African Origins theory must be seriously reworked. The same would be true if selection is operating on the non-African sequences. If real-world populations violate the central assumptions of SNM, the conclusions of studies that assume SNM are not and cannot be the final word on the subject.
We can conclude that the assumptions behind SNM are not completely realistic. The real situation is much more complicated than the simplifying assumptions allow (figure 3) and several of these assumptions are either biased in favour of the conclusion or contrary to the data. Crossing over is not random. Population structure exists at all scales. Population admixture (especially if it occurred in the distant past) and gene conversion overly complicate the models. The presence of natural selection among human mitochondria removes the ‘neutral’ part of the SNM as far as RAO’s Mitochondrial Eve is concerned.
Finally, RAO and SNM are based on the belief that evolution can occur, but that it cannot affect the things that control the speed of evolution. There is no room for differences in mutation rates30,31 among populations caused by environmental stress,33,34 nutrition,36 demographics (life-history patterns caused by cultural factors), or mutations in DNA polymerase and the DNA copying, proofreading or correcting mechanisms.37,38
It has now been shown that the most popular evolutionary model of recent human evolution is unsatisfactory. But with what shall we replace it? The biblical model for human genetic history is still in its infancy. I hope this short article will spark creative thinking in other creation scientists, who will take up the torch by attacking evolutionary theory at its roots: but also, that they will succeed in introducing new ideas to the community at large. There is much work to be done. I have only sketched an outline and I have only hinted at several lines of thought that might be quite productive to creationist research.

Acknowledgments

The writing of this paper was heavily influenced and partially supported by J. Sanford. I would like to thank one of the reviewers in particular for an excellent critique; the manuscript was significantly improved as a result.

Related Articles

Further Reading

References

  1. Rosenberg, N.A. et al., Genetic Structure of Human Populations, Science 298:2381–2385, 2002. Return to text.
  2. Cann, R.L., Stoneking, M. and Wilson, A.C.. Mitochondrial DNA and human evolution, Nature 325:31–36, 1987. Return to text.
  3. Haldane, J.B.S., The cost of natural selection, Journal of Genetics 55:511–524, 1957. Return to text.
  4. ReMine, W.J., Cost theory and the cost of substitution—a clarification, Journal of Creation 19(1):113–125, 2005. Return to text.
  5. Woodmorappe, J., Junk DNA indicted, Journal of Creation 18(1):27–33, 2004. Return to text.
  6. Kimura, M., Evolution rate at the molecular level, Nature 217:624–626, 1968. Return to text.
  7. Sanford, J., Genetic Entropy and the Mystery of the Genome, FMS Publications, Waterloo, NY, 2008. Return to text.
  8. Tajima, F., Statistical-method for testing the neutral mutation hypothesis by DNA polymorphism, Genetics 123:585–595, 1989. Return to text.
  9. Ptak, S.E., Voelpel, K. and Przeworski, M., Insights into recombination from patterns of linkage disequilibrium in humans, Genetics 167:387–397, 2004. Return to text.
  10. Garrigan, D. and Hammer, M.F., Reconstructing human origins in the genomic era, Nature Reviews Genetics 7:669–680, 2006. Return to text.
  11. Reich, D.E. et al., Linkage disequilibrium in the human genome, Nature 411:199–204, 2001. Return to text.
  12. Gabriel, S.B. et al., The structure of haplotype blocks in the human genome, Science 296:2225–2229, 2002. Return to text.
  13. Voight, B.F. et al., A map of recent positive selection in the human genome, PLoS Biology 4(3):446–458, 2006. Return to text.
  14. Frisse, L. et al., Gene conversion and different population histories may explain the contrast between polymorphism and linkage disequilibrium levels, American Journal of Human Genetics 69:831–843, 2001. Return to text.
  15. Becquet, C. et al., Genetic structure of chimpanzee populations, PLoS Genetics 3(4):617–626, 2007. See also . Return to text.
  16. Kaessmann, H., Wiebe, V. and Pääbo, S., Extensive nuclear DNA sequence diversity among chimpanzees, Science 286:1159–1162, 1999. See also . Return to text.
  17. Wall, J.D. and Pritchard, J.K., Assessing the performance of the haplotype block model of linkage disequilibrium, American Journal of Human Genetics 73:502–515, 2003. Return to text.
  18. Przeworski, M. and Wall, J.D., Why is there so little intragenic linkage disequilibrium in humans? Genetic Research, Cambridge 77:143–151, 2001. Return to text.
  19. Behar, D.M. et al., and The Genographic Consortium, The dawn of human matrilineal diversity, American Journal of Human Genetics 82:1130–1140, 2008. Return to text.
  20. Cavalli-Sforza, L.L., Menozzi, P. and Piazza, A., The History and Geography of Human Genes, Princeton University Press, Princeton, NJ, 1994. Return to text.
  21. Rohde, D.L.T., Olson, S. and Chang, J.T., Modelling the recent common ancestry of all living humans, Nature 431:562–566, 2004. Return to text.
  22. Bulayeva, K.B. et al., Ethnogenomic diversity of Caucasus, Daghestan, American Journal of Human Biology 18:610–620, 2006. Return to text.
  23. Bamshad, M. et al., Genetic evidence on the origins of Indian caste populations, Genome Research 11:994–1004, 2001. Return to text.
  24. Liu, H. et al., A geographically explicit genetic model of worldwide human-settlement history, American Journal of Human Genetics 79:230–237, 2006. Return to text.
  25. Wall, J.D. and Pritchard, J.K., Haplotype blocks and linkage disequilibrium in the human genome, Nature Reviews Genetics 4:587–597, 2003. Return to text.
  26. Wilson, J.F. and Goldstein, D.B., Consistent long-range linkage disequilibrium generated by admixture in a Bantu-Semitic hybrid population, American Journal of Human Genetics 67:926–935, 2000. Return to text.
  27. Torroni, A. et al., Harvesting the fruit of the human mtDNA tree, TRENDS in Genetics 22(6):339–345, 2006. Return to text.
  28. Rozen, S. et al., Abundant gene conversion between arms of palindromes in human and ape Y chromosomes, Nature 423:873–876, 2003. Return to text.
  29. Skaletsky, H. et al., The male-specific region of the human Y chromosome is a mosaic of discrete sequence classes, Nature 423:825–838, 2003. Return to text.
  30. Torroni, A. et al., Do the four clades of the mtDNA haplogroup L2 evolve at different rates? American Journal of Human Genetics 69:1348–1356, 2001. Return to text.
  31. Howell, N. et al., African haplogroup L mtDNA sequences show violations of clock-like evolution, Molecular Biology and Evolution 21(10):1843–1854, 2004. Return to text.
  32. Friedlaender, J. et al., Expanding Southwest Pacific mitochondrial haplogroups P and Q, Molecular Biology and Evolution 22(6):1506–1517, 2005. Return to text.
  33. Mishmar, D. et al., Natural selection shaped regional mtDNA variation in humans, Proceedings of the National Academy of Sciences (USA) 100(1):171–176, 2003. Return to text.
  34. Moilanen, J.S., Finnilä, S. and Majamaa, K., Lineage-specificselection in human mtDNA: lack of polymorphisms in a segment of MTND5 gene in haplogroup J, Molecular Biology and Evolution 20(12):2132–2142, 2003. Return to text.
  35. Zerjal, T. et al., The genetic legacy of the Mongols, American Journal of Human Genetics 72:717–721, 2003. Return to text.
  36. Ames, B., Low micronutrient intake may accelerate the degenerative diseases of aging through allocation of scarce micronutrients by triage, Proceedings of the National Academy of Science (USA) 103(47):17589–17594, 2006. Return to text.
  37. Copeland, W.C. et al., Mutations in DNA polymerase gamma cause error prone DNA synthesis in human mitochondrial disorders, Acta Biochemica Polonica 50(1):155–167, 2003. Return to text.
  38. Lee, H.R. and Johnson, K.A., Fidelity of the Human Mitochondrial DNA Polymerase, The Journal of Biological Chemistry 281(47):36236–36240, 2006. Return to text.
  39. Carter, R. Mitochondrial diversity within modern human populations, Nucleic Acids Research 35(9):3039–3045, 2007. Return to text.
.... 

Taken from: http://creation.com/neutral-model-of-evolution-recent-african-origins

A shrinking date for ‘Eve’


Most creationists will have by now heard of the ‘mitochondrial Eve’ hypothesis, the finding that all modern humans can be traced back to one woman. Some recent findings on when ‘Eve’ is supposed to have lived are very encouraging for creationists. But first we should review a few things, and hopefully sweep away some common misunderstandings.
Evolutionists do not claim, nor can it be fairly stated, that this evidence proves that there was only one woman alive at any point in the past. Holders to the ‘Eve’ theory certainly insist that all modern humans are indeed descended from one woman. However, they believe that there were other women present at the time, and that any of these other women could have contributed DNA information to our present gene pool of humanity. How does this apparent contradiction come about?
The answer lies in the fact that while we all inherit our usual complement of (nuclear) DNA from both mother and father, we only inherit mitochondrial DNA (mtDNA) from our mother. Think of it like a surname, only related to the opposite sex. In our society, we inherit our surname only from our father. A surname can become ‘extinct’ without implying that all the people in a line have died out—all it takes is for there to be only female descendants at any level.
In the same way, if a line of descent in a human population has only males at one point, then that line ‘dies out’ as far as its ‘mitochondrial signature’ is concerned, i.e., nuclear DNA is still passed on, but not mtDNA. To make it easier to understand, let’s return to the surname analogy (then later just substitute females for males). Imagine that an island is colonised by four couples, each with the first names Harry and Sally, but with four different surnames: Smith, Jones, Brown and White. In due course the population grows, with each generation marrying only among any of the other surnames available. It is very easy to set up a simple computer simulation to show how readily a surname can ‘die out’ with a line ending in only daughters. In due course, all the people on that island could end up with one surname only—say Smith. (Something like this happened on Pitcairn Island. Of the nine Bounty mutineers, six families settled the island in 1790. Of those six names [Christian, Young, Adams, McCoy, Quintal, Mills] only the first two have survived, even though Christian and Young were not the only ‘founding fathers’ to contribute genes to the island’s current small population. And some names have been ‘added’ from outside male settlers in the interim.) This is only probable where there is only a small number of surnames initially, i.e., a small original population; if the number of surnames is too large, it becomes very improbable for it to narrow down to only one or two.
In one sense it could be said that ‘Harry Smith’ is the ‘father of all on the island’. Yet this does not imply that Harry Jones, for example, is not the ancestor of any of them. Harry Jones could very well have contributed nuclear DNA to any of today’s islanders, without being their ‘surname ancestor’.
Let’s say you are a researcher investigating this particular island, without the benefit of any written records. You notice that all people on the island today are named Smith. Now this could be for two reasons:
  1. Because there really was only one couple that colonised the island in the beginning, called ‘Smith’, or
  2. There was only a small number of surnames on the islands to begin with, and the other surnames became extinct.
Returning to the ‘Eve’ debate, it is clear from the above example (by just swapping the sexes around) that the evidence from mtDNA, which has suggested that all modern humans come from one woman, can mean one of two things.
  1. There really was only one couple in the beginning—i.e, mitochondrial Eve could be the real (biblical) Eve, or:
  2. All modern humans are descended from only a small population existing at one time. The other ‘mitochondrial lines’ (from the other females living alongside the one whose mitochondrial ‘surname’ is found in all populations today) have become extinct whenever a line had no female offspring. ‘Mitochondrial Eve’ is the only one of the original population in whose offspring there has been a continuous supply of female descendants in each generation. Any of the other women living alongside her could have contributed nuclear DNA to today’s populations, via their sons.
I trust the analogy is clear. The mitochondrial Eve data does not force the belief that there was only one woman from whom we all descended—in other words, it doesn’t prove the Bible—but—a very important ‘but’—it is most definitely consistent with it. In other words, had there been more than one mitochondrial ‘surname’, it would have been a severe challenge to the biblical scenario. And it was not something that was expected by evolutionists. To explain it in their scenario requires a small population of modern humans to arise in one part of the world (archaic humans having already evolved and spread across the globe), and from there, spread out to replace all the other less-evolved humans, so that we all descend from that small original population (the ‘out-of-Africa’ or ‘Noah’s Ark’ theory of human evolution).
The biblical creationist would conclude that the one woman suggested by the mitochondrial data is almost certainly the real Eve.1

When did ‘Eve’ live?

Evolutionists, aware of the way in which the mitochondrial Eve discovery could be seen to have vindicated the Bible, have long countered by saying that their ‘Eve’ lived far too long ago to be the biblical Eve. How do they calculate this? The answer has to do with why this scenario came about in the first place. MtDNA is known to be much more transparent to selection than nuclear DNA. In other words, there are many places where a genetic ‘letter’ can be replaced with another by way of a mutational ‘copying mistake’ without causing any problems to the organism. Comparisons between various groups of people alive today can be made on the basis of the number of letters which are ‘different’, having been substituted by mutation. Modern humans were much closer to each other than standard evolutionary theory had predicted, hence the out-of-Africa theory.
Evolutionists have guessed at when their mitochondrial Eve lived via the idea of the ‘molecular clock’—i.e., that there is a more or less fixed rate of mutational substitutions per year in any population. How do they know what this rate is—in other words, how is the ‘molecular clock’ calibrated? By using evolutionary assumptions about the timing of events based on their interpretation of the fossil record. For example, if it is believed that humans and baboons, for example, last shared a common ancestor ‘x’ years ago, and if the number of differences between baboon and human mtDNA is y, then the substitution rate per year is y/x. In this way, estimates of when ‘Eve’ lived have varied from as low as 70,000 to 800,000 years ago, more commonly in the range 200-250,000 years.
It has recently been claimed that Neandertals were not direct human ancestors, but a different species in fact. This claim has been made on the basis of the number of substitutional differences in one stretch of mtDNA between that extracted from the one Neandertal ever tested and the average of today’s populations. In a consistent biblical model, there would be no ‘proto-humans’ having music, jewellery, trade, clothing, shelter, sophisticated hunting weapons and the like. ‘If he/she acts in so many respects like a human, he/she is a human’—and thus a descendant of Adam. Neandertals (some of whose physical traits can be found in some European populations) were not a different species (or a spiritless race not descended from Adam, as Rossists proclaim) but were post-Flood humans, representing a subset of the original gene pool broken up at Babel.
Creationists have correctly countered both Eve’s ‘age’ and the Neandertal assertions by saying that the molecular clock calibrations are way off.2 Since, for example, the creationist’s (true) Eve lived only a few thousand years ago, the mutational substitutions in mtDNA must have happened at a much faster rate than assumed by evolutionists to date.

Good news

In fact, a number of recent studies on living populations have indeed come up with results which indicate a much higher rate of mutation in human mtDNA.3,4
Although not all studies to date have found the same high rate, at least two studies, looking directly at substitutions occurring today, have found rates as much as 20 times higher than previously assumed.5 Studies on the bones of the last Tsar of Russia also showed that he, along with 10–20 % of the population, actually had at least 2 types of mtDNA, a condition called ‘heteroplasmy’, also caused by mutations.3 This, too, throws off the ‘molecular clock’ calibrations.
According to one review of the data, these recent results would mean that mitochondrial Eve ‘lived about 6500 years ago—a figure clearly incompatible with current theories on human origins. Even if the last common mitochondrial ancestor is younger than the last common real ancestor, it remains enigmatic how the known distribution of human populations and genes could have arisen in the past few thousand years.’3
The review in Science’s ‘Research News’ goes still further about Eve’s date, saying that ‘using the new clock, she would be a mere 6000 years old.’ The article says about one of the teams of scientists (the Parsons team5) that ‘evolutionary studies led them to expect about one mutation in 600 generations ... they were “stunned” to find 10 base-pair changes, which gave them a rate of one mutation every 40 generations’.4
Evolutionists have tried to evade the force of these results by countering that the high mutation rate only occurs in certain stretches of DNA called ‘hot spots’ and/or that the high (observed) rate causes back mutations which ‘erase’ the effects of this high rate. Therefore, conveniently, the rate is assumed to be high over a short timespan, but effectively low over a long timespan. However, this is special pleading to get out of a difficulty, and the burden of proof is on evolutionists to sustain the vast ages for ‘Eve’ in the face of these documented, modern-day mutation rates. These are indeed encouraging results for creationists. In summary:
  1. The mitochondrial Eve findings were, in the first instance, in line with biblically-based expectations; while not proving the biblical Eve, they were consistent with her reality, and were not predicted by evolutionary theory.
  2. The dates assigned to mitochondrial Eve were said by evolutionists to rule out the biblical Eve. But these dates were based upon ‘molecular clock’ assumptions, which were calibrated by evolutionary beliefs about when certain evolutionary events occurred, supposedly millions of years ago.
  3. When these assumed rates were checked out against the real world, preliminary results indicate that the mitochondrial ‘molecular clock’ is ticking at a much faster rate than evolutionists believed possible. If correct, it means that mitochondrial Eve lived 6,000 to 6,500 years ago, right in the ballpark for the true ‘mother of all living’ (Genesis 3:20).
  4. These real-time findings also seriously weaken the case from mitochondrial DNA which argued (erroneously) that Neandertals were not true humans.

Further Reading

References

  1. I say ‘almost certainly’ to cover the claim that she may have been one of the small post-Flood population, although I would not expect sufficient mtDNA divergence in the small number of generations between creation and the Flood. Return to text.
  2. Lubenow, M.L., 1998. Recovery of Neandertal mtDNA: an evaluation. Journal of Creation 12(1):87–97. Return to text.
  3. Loewe, L and Scherer, S.Mitochondrial Eve: the plot thickens.’ Trends in Ecology and Evolution, 12(11):422–423, November 1997. Return to text.
  4. Gibbons, A. ‘Calibrating the Mitochondrial Clock’. Science 279(5347):28–29, January 2, 1998. Return to text.
  5. Parsons, T.J. et al ‘A high observed substitution rate in the human mitochondrial DNA control region’, Nature Genetics Vol. 15: 363–368, 1997; as cited in ref. 4. Return to text.
(Available in Spanish)

....

Taken from: http://creation.com/a-shrinking-date-for-eve

Was Adam from Australia?


The mystery of ‘Mungo Man’


17 January 2001, updated 20 February 2003

Although many Australians believe their continent to be something akin to the Garden of Eden, the answer, sadly for them, is no, Adam was not from Australia, despite recently reported findings.
UPDATE 20 February 2003
The so-called infallible dating methods that assigned a date of 62,000 years ago to Mr Mungo are now considered to be flawed. Now they have revised the date considerably downwards to 40,000 years. See Tests knock 22,000 years off ‘Mungo Man’, based on Bowler, J.M. et al., New ages for human occupation and climatic change at Lake Mungo, Australia Nature 421:837–840, 20 February 2003.
Current ideas by the evolutionary establishment on the origin and evolution of modern humans seem to be in a continuous state of ... well, evolution. For example, a news article from December 2000, Mother Africa: Mitochondrial DNA Study Supports ‘Out of Africa’ Evolution (News/human_evolution001206.htm>, which is no longer available online) reported that, according to recent mtDNA research, the date of our early ancestors’ migration out of Africa needed to be revised from 100,000 years ago, to 52,000 years ago. This research seemed to lend credence to the ‘Out of Africa’ hypothesis, which states that Homo sapiens evolved in Africa and rapidly migrated across the world and replaced other hominids. For responses, see ‘Out of Africa’? A brief response ... and A shrinking date for ‘Eve’.
Now a recent find by a team of Australian researchers claims to bolster another, competing idea concerning human origins.1 DNA tests conducted on the remains of an anatomically modern human (dubbed ‘Mungo Man’) found in New South Wales, Australia in 1974 supposedly show that he was genetically different from modern humans—despite looking identical to people living today.2 This would mean that Mungo Man was not descended from the small group of Homo Sapiens that allegedly evolved in Africa. This apparently casts doubt on the ‘out of Africa’ idea, and supports the opposing view, called the ‘regional-continuity theory’ (or ‘multi-regional’ or ‘candelabra’ theory), which suggests ‘modern man evolved from Homo erectus[3] in several different places.’4
Dr Carl Wieland explains both the ‘out of Africa’ and ‘regional-continuity’ ideas and offers a Biblical view in his article, No Bones about Eve. The acrimony between the proponents of these rival theories is due to, according to the anthropologist Peter Underhill of Stanford University: ‘Egos, egos, egos. Scientists are human.’5
Incidentally, the ages assigned to Mungo Man allow us the opportunity to once again point out the tenuous nature of any secular dating method: originally assigned the age of 40,000–45,000 years old by the man (Professor Jim Bowler) who discovered the bones, Mungo Man received another age of 62,000 years in May 1999 by Dr Alan Thorne, who conducted tests using methods different from Bowler’s. The evolutionary paleoanthropologist Peter Brown mentions a number of problems with the 62,000 year date, citing with approval the papers by Bowler and others in Journal of Human Evolution, e.g.:6
  • internal inconsistency
  • inconsistency with other dating methods
  • inappropriate selection of samples
  • problems with the assumptions.
Professor Bowler stands by his age and Dr Thorne believes his age to be right.7
Which is the correct age for Mungo Man—40,000 or 62,000? The criticisms—by evolutionists!—just show that all ‘dating’ methods, like all claims about the past, have problems because scientists who weren’t there have to make certain assumptions. This is far from a rare example of the fallibility of dating methods—see Q&A: Radiometric Dating.
If one accepts the assumption that the Bible is the infallible eye-witness account of creation (see Q&A Bible for good reasons to believe this), then one would argue that neither 40,000 or 62,000 is correct. Rather, the Biblical framework suggests that Mungo Man lived less than 4500 years ago—after Noah and his family came off the Ark and after the dispersion at Babel.
It’s important to note that of the two evolutionary dates put forward, either one would further damage the credibility of Hugh Ross and other compromisers, who try to marry the Bible with billions of years and a local flood. Ross dates this Flood that wiped out all humanity (apart from Noah and his three sons) at 20–30 thousand years ago. Since he claims it was a local middle Eastern flood, he has to claim that humanity had not yet dispersed beyond the Middle East. Yet here we have humans that looked identical to modern humans living well before his date of the Flood. This puts day-agers like Ross in a bind, because they affirm the general reliability of long-age dating methods in other respects.
Dr John Mitchell of La Trobe University adds another interesting facet to ‘Mungo Man’ by saying, ‘The sheer ability to analyse 60,000-year-old DNA is revolutionary.’8 Perhaps this comment stems from the fact that DNA has been shown to decay relatively rapidly after death (living cells have elaborate repair mechanisms), and would not be expected to survive longer than around 50,000 years.9 Of course, starting from the Biblical framework, we would say that since Mungo Man is, in fact, only a few thousand years old, it is perfectly within reason to expect some DNA to have survived.

So, who was ‘Mungo Man’ and when did he live?

The Bible reveals that all humans share a common ancestor in Adam, and more recently Noah. After Noah and his family came off the Ark, God used the confusion of languages at Babel (at around the time of Peleg, Genesis 10:25) to cause Noah’s descendants to spread out and fill the earth (Genesis 11:1–9). Therefore, Mungo Man lived less than 4500 years ago and was a relative to you and me.

References and notes

  1. Holden, C., Oldest Human DNA Reveals Aussie Oddity, Science 291(5502):230–231, 12 Jan 2001. Return to text.
  2. Since no-one doubts that Mungo was a true human, it shows that allegedly largely different DNA is not proof that Neandertals were not human either. See Note 3. Return to text.
  3. Most modern creationists regard Homo erectus as a variety of true humans, descended from Adam and Eve, and probably post Babel. This is supported by the overlapping of cranial vault sizes (Woodmorappe, J., How different is the cranial-vault thickness of Homo erectus from modern man? TJ 14(1):10–13, 2000) and many other physical characteristics (see The non-transitions in ‘human evolution’ — on evolutionists’ terms and Marvin Lubenow’s book Bones of Contention). And an article by Wolpoff et al. in Science 291(5502):293–297 (comment p. 231), as recently as 12 Jan 2001, showed that the features of various human skulls indicated that there must have been interbreeding among modern-looking Homo Sapiens and Neanderthals and even Homo erectus (Claims of Neanderthal and Human Mixing Leave Some Cold, NYTimes.com, 14 January 2001). Thus they are all the same species by definition, and therefore Hugh Ross is wrong to claim that the latter were soulless pre-human hominids.Return to text.
  4. Scientists Challenge Evolution Theory, ABCNews.com, 10 January 2001. Return to text.
  5. Claims of Neanderthal and Human Mixing Leave Some Cold, NYTimes.com, 14 January 2001. Return to text.
  6. Brown, P., The first Australians: The debate continues, Australasian Science 21(4):28–31, May 2000. Return to text.
  7. Tait, Paul. Fossil Finder Disputes Age, Backs Evolution Claim, Daily News, 10 January 2001. Return to text.
  8. Dayton, Leigh. DNA clue to man’s origin, The Australian, 10 January 2001. Return to text.
  9. Lindahl, T., ‘Instability and decay of the primary structure of DNA’, Nature 362(6422):709–715, 1993. S. Pääbo has found that DNA fragments a few hours after death into chains 100–200 units long, that water alone would completely break it down by 50,000 years, and that background radiation would eventually erase DNA information even without water and oxygen, ‘Ancient DNA’, Scientific American 269(5):60–66, 1993. Return to text.
....
 

Thursday, June 26, 2014

Mungo Man : Turning evolution upside down


In the study of human evolution, Australia has not traditionally believed to have much to offer; however, the skeletal record has thrown up a few spanners in the works that may one day transform beliefs about where humans came from.
One of these spanners is Mungo Man, who was discovered in 1974 in the dry lake bed of Lake Mungo in west NSW. Mungo Man was a hominin who was estimated to have died 62,000 years ago and was ritually buried with his hands covering his penis. Anatomically, Mungo Man's bones were distinct from other human skeletons being unearthed in Australia. Unlike the younger skeletons that had big-brows and thick-skulls, Mungo Man's skeleton was finer, and more like modern humans.
The ANU's John Curtin School of Medical Research found that Mungo Man's skeleton's contained a small section of mitochondrial DNA. After analysing the DNA, the school found that Mungo Man's DNA bore no similarity to the other ancient skeletons, modern Aborigines and modern Europeans. Furthermore, his mitochondrial DNA had become extinct. The results called into question the 'Out of Africa' theory of human evolution. If Mungo Man was descended from a person who had left Africa in the past 200,000 years, then his mitochondrial DNA should have looked like all of the other samples.
Human tree evolution
Another spanner in the traditional theories are the Kow Swamp skeletons from northern Victoria, which are reminiscent of Homo erectus. Specifically, they have thick brow ridges, sloping foreheads and very large teeth. If the Kow Swamp skeletons had been found in Indonesia and dated at 100,000 + years, then they might have been categorised as Homo erectus but being found in Australia and dated at only 10,000 years was problematic. According to traditional theories, Homo erectus never reached Australia and was believed to have died out when Homo sapiens reached Indonesia in excess of 50,000 years ago. Even if the Kow Swamp people weren't Homo erectus, it was hard to explain why an ancient looking people occupied Australia after a more modern looking people. As explained by Professor Alan Thorne,
"The Kow Swamp people have thick brow ridges, very large faces and the biggest teeth that have ever existed in modern humans. And that creates a problem. They look ancient but at 10,000 years of age they’re much younger than the lightly built Mungo people. How could that be?"
One academic, Dr Tim Stone from the University of Melbourne, tried to argue the unusual skeletal shapes were the result of some kind of localised adaptation to the cold. (1) Stone basically argued that the Homo sapiens of the area evolved to look like Homo erectus because the body shape was better suited to the climate. No other Australian population groups looked like them because the Kow Swamp people became geographically isolated for tens of thousands of years. This was an illogical explanation considering that Kow Swamp was on a relatively flat area of land near the Murray River, which would likely attract high volumes of human traffic. As a point of comparison, a small population of humans in Tasmania were genetically isolated for at least 10,000 years in a very cold climate. Although paintings and photos show a slight divergence from some mainland Aborigines, their skeletons and features looked very similar to modern gracile humans.
Tasmanian Aborigines looked a lot like Africans but despite being isolated for perhaps 10,000 years in a cold climate, they still looked like modern humans.
Others have argued that the unusual head shapes were the result of cranial modification by mothers wrapping cloth around their infants' heads (3) . This was also an illogical explanation as body modification of infants tends to be a feature of agricultural societies that have developed hierarchical systems of status. Body modification in hunter gathering societies tends to occur during teenage years as part of initiation ceremonies. Furthermore, cranial modification in hunter gatherer societies would have had to use animal skin, which could be risky as animal skin can expand and shrink thus potentially killing the baby. In short, if cranial modification was occuring, then the Kow Swamp people probably weren't hunter gatherers, which would be as problematic as proposing they were Homo erectus.
One academic defending the orthodox position, Dr Colin Groves, didn't even bother offering any explanations and simply said that those who did were racist because the explanations would interfere with contemporary activist campaigns. In his own words:
"But at the same time as one "pure-race" hypothesis was hitting the dust, another was rising. Ancient Australian skeletons were being discovered in Victoria and southern New South Wales, and they seemed to show great diversity. None of them were Negritos, Murrayians or Carpentarians, but those from Keilor and Lake Mungo were like modern Aboriginal people, whereas some (not all) of those from Kow Swamp had very flat, sloping foreheads, and some people even likened them to so-called "Java Man", Homo erectus, that had preceded modern humans (Homo sapiens) in the region to the Northwest of Australasia at least as late as 300,000 years ago. Unfortunately, although Alan Thorne, the describer of the Kow Swamp skeletons, never actually said that they were Homo erectus, the idea that an extremely primitive people preceded the present Aboriginal people in Australia, and was eliminated by them, seems to have seeped into some folks' consciousness just like the Negritos did. Negritos or Homo erectus - either way, the Aborigines were not the first possessors of Australia so the land doesn't really belong to them and the whites needn't feel too bad about dispossessing them. Really good fodder, this, for the One Nation Party, and the Prime Minister needn't feel he has to say "sorry".
If sarcasm and the need to conform to contemporary activist campaigns were highly valued qualities in academic inquiry, then it appeared as though Groves had made a powerful and compelling argument.
Different humans found in Australia

Some theories based on the skeletal record have proposed that the first humans in Australia were the "negrito" Tasmanian people, who were displaced by "Murrayans", who were in turn displaced by "Carpentarians". Academics like Dr Colin Groves have proposed that the theories are racist and that there was only one migration and all Aborigines are the descendents from that one migration.
Out of Africa Theory
The 'Out-of-Africa' theory proposes that 1.4 million years ago Homo erectus left Africa and spread throughout Europe and Asia. In Europe, Homo erectus evolved into the Neanderthals. In Asia, most Homo erectus stopped evolving - with the exception of a small group in the Indonesian archipelago that branched off to become Homo floresiensis (aka the Hobbit). Unlike most of the Homo erectus in new Asian environments, which stagnated, the Homo erectus that stayed in Africa continued to evolve and eventually became Homo sapiens.
About 200,000 years ago, Homo sapiens left Africa. They spread throughout the globe and conquered or out-competed Neanderthals and Homo erectus. The last Neanderthal died out around 30,000 years ago. The last Homo erectus died out somewhere between 200,000 and 30,000 years ago. The last Hobbit is believed to have died out in a volcanic eruption around 10,000 years ago. After conquering Homo erectus in Indonesia, Homo sapiens moved to Australia. If Homo erectus had made it to Australia first, then they too would have been conquered.
In a nutshell, 200,000 years ago an African tribe, either through superior food gathering ability or open war, started the extinction of all hominin species living throughout Eurasia.
Supporting the Out-of-Africa theory was work by Allan Wilson who provided evidence in 1987 that all modern humans share a single female ancestor who lived in Africa approximately 200,000 years ago.
Interactive journey of humanity - http://www.bradshawfoundation.com/journey/
Out of Africa gene flow
Nature 408, 7 Dec 2000, p. 653
Regional Continuity or Multiregional Evolution
Mungo Man is a huge spanner in the works for the Out-of-Africa theory because it can't explain how Mungo Man looked liked modern humans, yet was not related to any human that had left Africa in the last 200,000 years. A 'Multiple-Regions' theory was held up as the answer. If Out-of-Africa is a theory of war, then Multiple Regions is a theory of sex. The theory proposed that Homo erectus was not conquered; rather, once Homo erectus left Africa 1.4 million years ago, it kept evolving on migration lines between Asia and Africa (and possibly Australia). Interbreeding among nomadic tribes kept most of the different groups on a relatively constant evolutionary track and ensured they remained the same species.
Most proponents of the Multiple-Regions theory argue that the Neanderthals in Eurasia and the Hobbit in Indonesia were not unique species and therefore must have contributed DNA to modern Homo sapiens.
Testing of Neanderthal DNA has produced mixed evidence. Repeated testing of mitochondrial DNA of modern humans found no evidence of Neanderthal DNA. Because mitochondrial DNA is passed on by women, the lack of it indicated that Homo sapiens do not have a female Neaderthal ancestor. Even though sapiens don't have female Neaderthal ancestors, they do have male Neandethal ancestors. In 2010, 60 per cent of the Neaderthal had been mapped and was subsequently compared to modern humans from Papua New Guinea, Europe, Asia and Africa. It found that 1-4% of modern human DNA, in populations outside of Africa, was Neanderthal in origin. While the results found evidence of male Neanderthal in non-African Homo sapiens, there was no evidence of Homo sapien DNA, either male or female, contributing to Neaderthal DNA.
The results suggested that Neanderthals had the ability to breed with Homo sapiens (so were not a unique species) but breeding was minimal. Furthermore, the one-way flow of genes, and the absense of Neaderthal mitochondrial DNA in modern humans, would suggest it was only a few Neanderthal men breeding with Homo sapien women. On the whole, the two Hominins bred very little.
Perhaps the small flow of genes could also be attributed to migration routes. The Neanderthals may have evolved independently because they were an ice age people living in caves. Ice age Eurasia was just too inhospitable for nomadic Homo erectus. Likewise, in the Indonesian archipelago, the ancestor of the Hobbit may have been cut off from migration routes due to changes in sea levels or volcanic activity. Consequently, they also become a unique species.
Aside from the Neanderthals and the Hobbits, all other Homo erectus keep migrating, keep breeding and kept evolving on a constant track. Eventually they evolved into Homo sapiens.
At some stage in the last 850,000 years (or longer), either Homo erectus or Homo sapiens made the crossing from Java to Australia. These hominins were the ancestors of Mungo Man. It would not have been a difficult crossing to make. Rats are believed to have made the crossing 2 million years ago.
200,000 years ago, females from an African tribe started spreading their genes through the entire arc between Australia and Africa. This spreading of female genes could have occurred as a result of a nomadic African tribe emerging from Africa and breeding throughout Asia. It could also have occurred as a result of an Asian tribe going to Africa, and forcibly taking women back to Asia. (*Although evidence indicates that all humans might have had a common female African ancestor 200,000 years ago, as yet there is no evidence to show a common male ancestor.)
60,000 years ago, Homo sapiens with African ancestors started migrating into Australia, and joined Mungo Man. The first group of Africans were known as Robust due to their heavy-boned physique. This group was significantly different from the slender body shaped Gracile of Mungo Man that was already in Australia. The Robust soon came to dominate Australia. Many thousands of years later, perhaps more people with a Gracile body migrated to Australia. The similarity in shape probably stemmed from parallel evolution rather than recent common ancestors. Alternatively, the Robust Homo sapiens perhaps evolved a more Gracile shape due to climatic changes. (Robust shapes were more suited to cold climates and tackling megafauna. Gracile shapes were more agile and had better endurance.) Aborigines today have a Gracile body shape that is like the 62,000-year-old Mungo Man but unlike the 10,000-year-old Kow Swamp people.
Homo erectus site map
Sites showing where Homo erectus was found. Debate exists about European sites. Some skulls have been found in Australia that show Homo erectus features but they have not been categorised as Homo erectus. Homo Flores (the hobbit) was found on the eastern side of the Wallace line, indicating that its Homo erectus ancestor had the capacity to make ocean crossings.
View on Evolution
One view on human evolution. Note, overlap is only deemed to have occured in Europe where Homo sapiens and Neanderthals co-existed. Homo floresiensis was not included.
Implications for Australia
If Out-of-Africa is to be believed, then human occupation of Australia has to be less than 200,000 years. Exactly when humans arrived would have been determined by how long it took Homo sapiens emerging from Africa to cause the extinction of the Homo erectus tribes spread throughout Asia. If Multiple Regions is to be believed, the length of human occupation of Australia can be greatly extended. Homo erectus was known to be in the Indonesian archipelago 850,000 years ago. If they had made the crossing to Australia, then hominin occupation of Australia could be anywhere up to 850,000 years.
It is generally believed that Homo erectus was not intelligent enough to make the boats that would have been required to cross to Australia. Arguably though, making a raft or a canoe is much much easier than making stone tools that can kill animals. Furthermore, Homo erectus obviously had a degree of intelligence as it had crossed rivers and adapted to diverse climates on its way from Africa to Java and Peking.
It should also be noted that the Hobbit was found on the Australian/Papua New Guinea side of the Wallace Line. In previous ice ages, Papua New Guinea was part of the Australian zooalogical regions and Flores showed signs of both Asian and Australian fauna. Stone tools on the island of Flores have been dated at 840,000 years, which proves that Homo erectus was capable of making a sea crossing. It also proves that after crossing the Wallace Line, Homo erectus gained the opportunity to migrate into Australia.
Wallace Line
The Wallace Line - A stretch of deep water that separates the zoological regions of Asia from those of Australia and Papua New Guinea. 840,000-year-old Homo erectus tools have been found on the Australian New Guinea side.
Sahul
Sahul – The land mass that comprised PNG and Australia during the last ice age. Australia was not as isolated as some people believe.
The possibility that Homo erectus made it to Australia was supported by archaeological excavations from 1968 to 1972 by Professor Alan Thorne at Kow Swamp, which found skeletons showing Homo erectus features. The main problem with seeing them as Homo erectus was that they were between 10,000 and 13,000 years old. If they were Homo erectus, then it would suggest that either Homo erectus lived in Australia until very recently, or came in a migration wave after Homo sapiens and then died out or was bred out.
Implications for human evolution
Survival of the Fittest proposes that the strongest and most intelligent will eventually emerge triumphant. Out-of-Africa supports the theory because it proposes a smart and strong African tribe was able to cause the extinction of all other hominin species spread across the globe. It caused the extinction due to its superior food gathering ability and/or superior battlefield might.
A Multiple-Regions theory indicates that Survival-of-the-Fittest is only half true. Physical weakness can aid promiscuity and therefore the proliferation of genes. In the case of the Neanderthals, the fact that male Neanderthals survives in the DNA of Homo sapiens but female Neanderthals DNA does not suggests that Neanderthal men probably raped Homo sapien women and the offspring was raised by Homo sapien tribes. It would have been easy for Neanderthals to rape the women because they were far stronger. (It is possible that Neanderthal boys/men were adopted by Homo sapien tribes but this would not explain why Neanderthal women were not adopted.) While Neanderthal men could rape Homo sapien women, Homo sapien men were too weak to rape the stronger Neanderthal women and to carry them back to the tribe as typically occurred in hunter gatherer communities. Ironically, by being strong, the Neanderthal women were not forcibly inducted into tribes that could survive.
Similar problems may have been experience by the women of Mungo Man’s tribe. If they were particularly agile or strong, other groups of Homo sapiens would not have been able to force them to join their tribes as was custom in hunter gathering. If the other tribes came to dominate, then the women’s evolutionary lines would have gone extinct like those of the Neanderthal.
1) Groves, Colin, (2002) Australia for the Australians http://www.australianhumanitiesreview.org/archive/Issue-June-2002/groves.html)
2) http://archive.uninews.unimelb.edu.au/news/1255/
3)Susan C. Antón, Karen J. Weinstein (1999) Artificial cranial deformation and fossil Australians revisited Journal of Human Evolution Volume 36, Issue 2, February 1999, Pages 195–209
[Top]

....

Taken from: http://www.convictcreations.com/aborigines/prehistory.htm