Jennifer Marohasy
There are adjustments on top of adjustments. Homogenised records are being used to correct raw records. Some man-made adjustments can infect data for miles around…
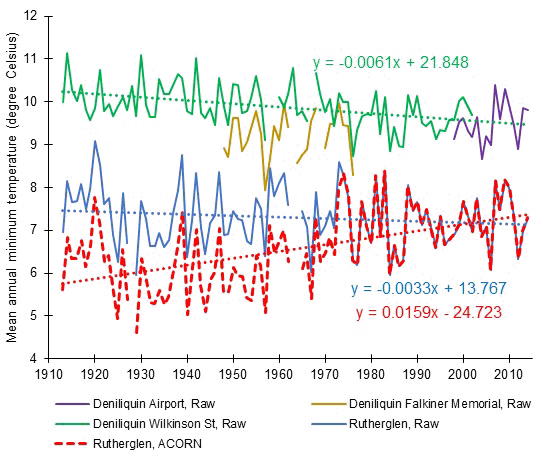
Rutherglen is a long running station in central Victoria. There are no documented site moves, but the long raw trend of slow cooling was adjusted up to a warming trend. What was cooling of 0.35C per century became a 1.7C warming trend.
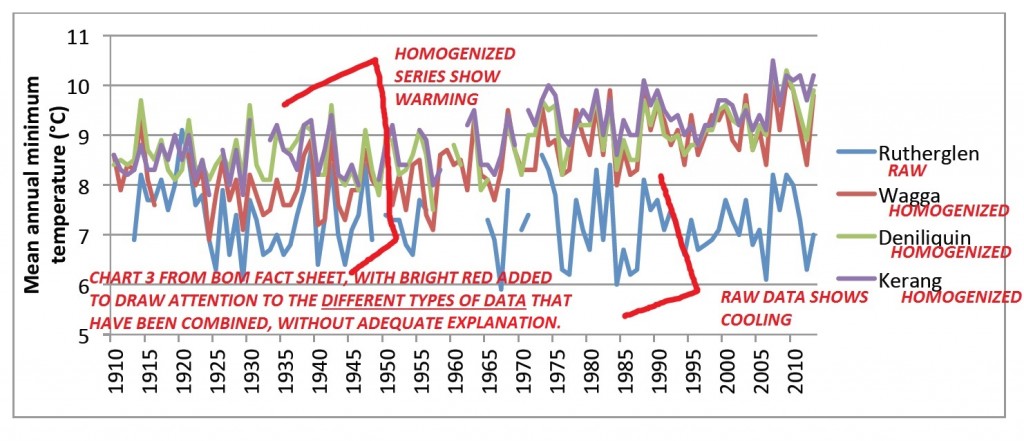
Jennifer Marohasy, and others, have spent months trying to get answers from the BOM explaining why these massive adjustments were made. Excuses flowed. In the latest round, the BOM claim the changes are necessary to make the Rutherglen record match the trends in the neighboring stations. What the BOM doesn’t say is that there was no warming in the neighbours either, not until after they were homogenized. The order in which stations are homogenized matters, which rather says something important about the arbitrary nature of the adjustments. Anomalous trends from far distant and poor locations can spread through waves of homogenization until better, longer stations succumb to political correctness and show the “correct” result. Small choices about which stations to to use first in the process can make a huge difference to the end result. Another reason the BOM needs auditing.
A poor Australian citizen might think after seeing this graph, below, from the BOM, that Rutherglen is out of step with its neighbours. Instead the taxpayer would need to go to Jennifer Marohasy’s site to get the full story. She has added the red notes to the chart to point out what the BOM don’t say: Wagga, Deniliquin and Kerang series were homogenized first. These trends were not what was recorded by thermometers. [UPDATE: Note that many raw records are patchy and not well documented. They often do need adjustment, but the reasons need to be transparent, exact, justified, and Australians need to know how influential these adjustments are.]
Marohasy also plotted the raw data from Deniliquin and Rutherglen, and explains that at the long running station in Wilkinson St Deniliquin there was a statistically significant cooling trend of 0.6C per century from
1910 to 20001913 – 2003. Actual raw data is available for Wilkinson St from February 1867 to June 2003, a remarkably long series.
She has written an open letter to the Chief Operating Officer, Vicki Middleton, pointing out the misleading nature of the Bureau of Meteorology graph, and asking that they correct their “Fact Sheet”.
This is not just about Rutherglen. If we look at historic records from 84 sites, two thirds of Australia’s warming trend comes from the adjustments.
What’s the answer? Replicate the BOM’s work
If it can’t be replicated, it isn’t science. The Bureau of Meteorology admits its methods are secret. [UPDATE: See the link -- the Bureau specifically admits no one outside the BoM can replicate their work because it would require detailed instructions, "operator training" and it's too "onerous".]
The BOM needs a full independent audit, staffed by people outside climate studies — we need physicists, statisticians, engineers, people with proven track records in areas of science or technology that work.
The only thing we know for sure about the BOM is that time and again, they’ve had the opportunity to explain their decisions and methods, and they choose not too. It’s an unscientific, “trust us” approach. If they were honest, and sincerely believed in their work, they would welcome the interest in the details of the historic Australian climate.
Would you buy shares in a company on the Australia Stock Exchange (ASX) that refused to allow audits of its finances? You couldn’t even if you wanted too – the ASX doesn’t allow them to list. Public companies welcome audits, to show everyone they are legit.
When the ABC misinforms Australians, the BOM don’t care. That says a lot about their priorities. Not serving the public, just serving “big-government”…
We need to get individual stations in order before we start blending bad data
The concept motivating homogenization is that errors in one station can be detected and corrected by comparing it to surrounding stations — if all the neighbors say one things and one station says something else, then the one station is probably wrong.
But how close need a neighbor be? Is a temperature record 500 km away to be relied upon to correct measurements taken at a site? Somehow the BOM has got itself in a real mess. Bad data, unrecorded site changes, and anomalous results abound, along with wacky square-wave monthly adjustments that defy explanation. Homogenisation should start with the best stations, but no one at the BOM has even figured out which stations are the best. There’s been no proper detailed historic analysis of each station. Someone needs to go back to photos, letters and newspapers. Lets start with data, dammit.
The only thing we know for sure is that we are not getting good answers
The history of the BOM’s explanations is that the adjustments to Rutherglen are major, and that explanations could be provided in days — but more than three years after ACORN was established there are still no good explanations, just a litany of weak excuses and the fog of evasion. The BOM ignored independent scientists until The Australian started writing up their questions. Only then did they bother to respond, and in the end, they admit they can’t explain something as simple as the reasons for their adjustments in something as scientifically banal as a single temperature sequence. This is not rocket science.
Nothing has changed from when I wrote this nearly a year ago:
Bottom line: The BOM has added a page listing “Adjustments”. It’s two years late, inadequate and incomplete. Skeptics shouldn’t have had to ask for it in the first place, and we still don’t have the algorithms and codes, or rational answers to most questions. No one can replicate the mystery black box homogenisation methods of the BOM — and without replication, it isn’t science. There is still no explanation of why an excellent station like Rutherglen should change from cooling to warming, except for vague “statistics”, or why any station should be adjusted without documentary evidence, based on thermometers that might be 300 km away*.
The adjustments page is just a glorified rehash of the same old excuses
Effectively the bureau is saying “we need large mysterious transformations of data to make Australian trends look like international trends”. What serious climate scientist thinks Australia is supposed to get hotter, colder, wetter, drier, or cloudier with the exact same timing and patterns to the rest of the world?
The Pacific Decadal Oscillation means that Australian trends are not going to be same as US trends. When it’s rainy here, it’s drier there. Dry soil heats up fast; wet soil keeps temperatures more stable (h/t to Bill for reminding us of the importance of rainfall).
The new gee-wizz data set called ACORN contains thousands of new mistakes that did not exist before, as discussed nearly a year ago. Nothing has changed.
Three years ago the independent audit team, with Senator Cory Bernardi, asked for an ANAO audit of the BOM’s “High Quality” HQ data set. The BOM was not enthused. They dumped the HQ set that they had previously lauded and set up a new one called “ACORN”. We listed some of the errors in June 2012.
TwoThree years on, nothing much appears to have changed. They still haven’t released the algorithms used in the homogenization process. They are still using stations more than 100km away, some 600 km away, to “adjust” temperatures. The mystery black box adjustments are still producing inexplicable nonsense, and the BOM still can’t explain why — on individual stations like Rutherglen and Bourke — anyone should find their adjustments necessary and scientifically justified.
The BOM’s active silence on the long hot records of the late 1880s and 1890s suggests they are more interested in promoting one message — “it’s warming” — rather than being custodians of the real and more complicated history of the Australian climate.
When will our elected representatives get the balls to do the right thing for the environment and demand the highest, most rigorous research on the Australian climate? For the sake of our farmers, national policy and land management, how can we predict the future climate if we don’t even know the history of how it has changed? (How Orwellian is that?) If the Greens cared about the climate, they would demand an independent review.
The bottom line on Rutherglen:
I don’t pretend to know what the end point answer should be. Rutherglen is not a perfect station, but we can’t even have a polite and rational conversation about it. The real dishonesty is in pretending that there is a meaningful trend to be found there or anywhere in the smoothed, blurred, and blended ACORN data. The BOM is not honest with the Australian public about the transformative but mysterious adjustments and the dismal state of our temperature records.
CONCLUSION: The egregious thing here is the way the trends, and the record events get reported as if they are unquestionable when so much manipulation is going on behind the scenes. That message is used as PR to sell policies, and is marketed as “science” when it is so flagrantly not.
Read the details at Jennifer Marohasy’s.
The BOM: Homogenizing the heck out of Australian temperature records,


No comments:
Post a Comment